- Solutions
ENTERPRISE SOLUTIONS
Infuse new product development with real-time intelligenceEnable the continuous optimization of direct materials sourcingOptimize quote responses to increase margins.DIGITAL CUSTOMER ENGAGEMENT
Drive your procurement strategy with predictive commodity forecasts.Gain visibility into design and sourcing activity on a global scale.Reach a worldwide network of electronics industry professionals.SOLUTIONS FOR
Smarter decisions start with a better BOMRethink your approach to strategic sourcingExecute powerful strategies faster than ever - Industries


Compare your last six months of component costs to market and contracted pricing.


- Platform
- Why Supplyframe
- Resources
Earlier this year, we released a report that compiled findings from Commodity IQ. It posed a simple question: Could tariffs be more disruptive to supply chains than COVID-19? The findings were fascinating, and it left open-ended questions about how things would progress as 2025 continued.
Now, as we approach the final months of the year, we’ve once again looked at demand, inventory, lead times, design activity, and pricing across major electronics commodities to identify the impact of tariffs and other ongoing challenges. Join us as we explore how typically reliable trends have shifted this year, and what it means for 2026.
The Ripple Effect of New Tariffs
In anticipation of new tariffs earlier in 2025, manufacturers around the globe began buying parts before the impact could affect things like pricing and lead times. This scramble to obtain components led to our first major shift we’ll be discussing in this article.
For context, Supplyframe Commodity IQ tracks a number of metrics like supply, demand, price, and lead times by using an Index system. These indices use a baseline to measure average levels. Anything above 100 illustrates growth, while anything below 100 implies a decrease compared to the 2020 median.
Consider this graph that illustrates demand trends over the course of the year:
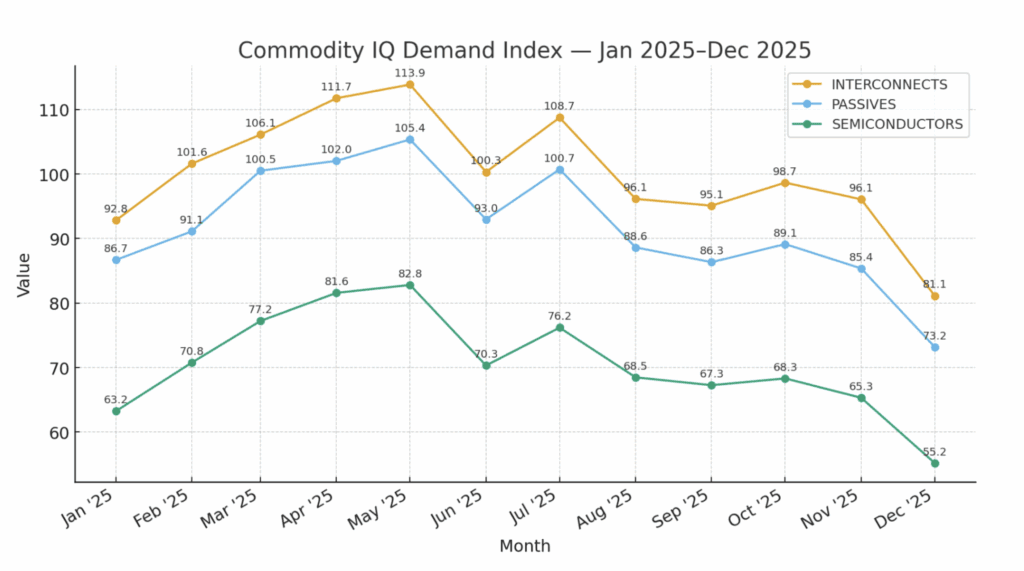
According to this data from Supplyframe Commodity IQ, the demand index peaked in Q2 in 2025, and has since declined rapidly towards the end of the year. As industry veterans will know, this is not the norm.
Electronics sourcing demand often peaks in the second half of the year, when major holidays and shopping trends hit their all-time highs annually.
Whether it’s Christmas, or New Year’s, or new product launches, Q3 and Q4 are the usual window for major spikes in demand and when companies increase manufacturing output.

That was not the case in 2025, as evidenced by the data above. Across interconnects, passives, and semiconductors, demand peaked in May and then declined rapidly, with a smaller additional spike in July.
And from July to August, interconnects declined by 11.6%, while passives went down 12%, and semiconductors dropped 10.1%. We know now that this demand surge earlier in the year was driven, of course, by pre-tarrif order frontloading.
According to current forecasts, all three commodity groups are also expected to reach four-year lows in December. An important thing to note as well is that the semiconductor category does not include the AI GPU segment that is driving the overall chip market. However, the semiconductor index still reflects trends observed in other commodity groups.
Now, let’s see how this ripple effect has impacted these categories in other areas.
Inventory Sees Mid-Year Drop, Followed by Swift Recovery
Inventory has also been impacted by buyer behavior surrounding tariffs. Here’s a look at how this metric has shifted:

In concert with the demand spike that started in Q1, you’ll notice that the inventory indexes for all three commodity groups dropped in February, declining by the largest sequential margin of the year so far. All three groups then went on to see inventory rates recover at different times later in the year. Let’s break down inventory trends for each category.
After a sharp 10% sequential decline in February, the interconnect index continued to experience inventory declines during most of the months through the end of Q2. Although the interconnect index rose in July and September to recover from its February low, the score remained below the baseline.
After falling by 5.2% in February, the passives index rebounded during the next two months, with a robust 17.1% rise in April bringing the score up to 78, marking its 2025 high. However, passives also remained beneath our baseline reading through September.
Lastly, the semiconductor index fell by 6.3% in February to reach its annual low, but then entered a growth phase, with increases in March, April, May, July, and August.
In general, semiconductors are driving the increase in inventories during the second half of 2025. After troughing at a score of 75 in February, as evidenced above, the semiconductor index rose to 89 in August, an 18.8% increase. Once again, the index lingered below the baseline.
In general, all three commodity groups have depeleted inventory levels when compared to the historical median, and of course, the drop in demand in the second half of the year has resulted in rising inventories as time goes on.
The Impact on Lead Times
Major shifts in both demand and stock have an effect on lead time as well. Consider the graph below:

In this case, the most significant impact was in the interconnects category. In general, though, lead times peaked in May of 2025, with new data and forecasts predicting they will continue to decline in Q4.
Passives and semiconductors are projected to drop 13.4% and 5.3%, respectively, in Q4. Passives in particular are set to hit their 2025 low in December. Interconnects will remain mostly flat in Q4, with a 2.8% decline.
Lead times for all three groups have normalized since the spikes in Q2. This is due to declining demand in the second half of the year in the wake of tariff frontloading. The key product class of microcontrollers and processors has also seen a similar pattern, as evidenced by the following:

Like other categories, lead times spiked for microcontrollers and processors in May of 2025. October brought a small decrease, followed by normalization.
If we turn our attention to analog lead times, the pattern is similar, illustrating the widespread impact of tariff-related frontloading:

Analog commodities saw their lead time spike in April and May, then plarteau in June, before dropping significantly in July 2025. Current projections show that lead times will drop 6.9% in Q4, compared to their Q3 2025 levels.
Lastly, we’ll take a look at how pricing will be affected by all of these shifts in other categories, and how buyers should adjust heading into 2026.
The Pricing Situation
Given the major changes in annual trends, it’s only fair to assume that pricing will also be affected by tariff-related purchasing.
Here is a look at 2025’s pricing shifts:
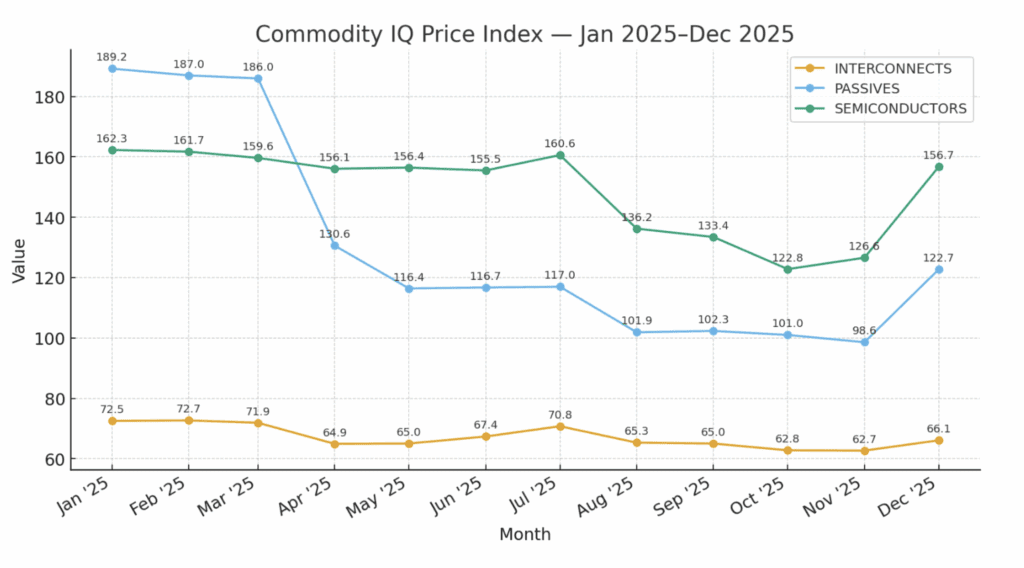
As you can see from the data above, pricing has either been flat or down as the year goes on, with the most significant changes happening between March and August. In September 2025, pricing trends were flat for all commodity groups, with interconnects down 0.4% sequentially, passives up by the same number, and semiconductors down 2.0%.
Looking ahead to Q4, prices are expected to be flat or down, with interconnects dropping 4.7%, passive rising by 0.3%, and semiconductors decreasing 5.6%.
Despite tariffs, pricing is flat to declining in Q4 due to decreased demand overall in the second half of the year. One major factor that has yet to be seen, however, is how the threatened semiconductor tariffs from the U.S. could affect prices if they were to be implemented.
Decision Support for What’s Next
Supplyframe Commodity IQ provides always-on decision support across over $160 billion in annual commodity spend.
With data from our global DSI Network of 12 million+ sourcing and engineering professionals, plus 1,000 practitioner, partner, and source contributions, this solution is every successful commodity manager’s secret weapon.
To learn more and dive deeper, visit Supplyframe.com.


")