- Solutions
ENTERPRISE SOLUTIONS
Infuse new product development with real-time intelligenceEnable the continuous optimization of direct materials sourcingOptimize quote responses to increase margins.DIGITAL CUSTOMER ENGAGEMENT
Drive your procurement strategy with predictive commodity forecasts.Gain visibility into design and sourcing activity on a global scale.Reach a worldwide network of electronics industry professionals.SOLUTIONS FOR
Smarter decisions start with a better BOMRethink your approach to strategic sourcingExecute powerful strategies faster than ever - Industries


Compare your last six months of component costs to market and contracted pricing.


- Platform
- Why Supplyframe
- Resources
Editor’s Note: This is the third article in a series discussing the findings from a NPI and Sourcing Study, done in partnership with Lifecycle Insights. The content below was produced by Lifecycle Insights. Click here to see the series overview.
Findings from Lifecycle Insights’ NPI and Sourcing Study reveal that some companies are thriving while others are merely surviving. To better understand the factors contributing to those performance differences, Lifecycle Insights separated study respondents into groups by common characteristics.
In this way, the study analysis highlights the specific differences in product development IT ecosystems, and how these differences impact NPI performance. This section describes how respondents were sorted into most progressive, moderately progressive, and least progressive groups, and examines each group’s practices and overall performance.
Distribution of Respondents into Groups
Each respondent was awarded points based on specific practices. These points were summed into an index. For this study, the index was based on:
- the breadth of the company’s DX efforts to improve its NPI process,
- the length of time the company had been pursuing those DX efforts, and
- the current state of the company’s DX for NPI efforts.
From there, Lifecycle Insights analyzed various percentage distributions of respondents. The most differentiated structure assigned the bottom 25% of index scores to the least progressive group, the middle 50% to the moderately progressive group, and the remaining 25% to the most progressive group. This division of respondents allowed the most accurate comparison of the factors affecting performance.
Performance Differences across Respondent Groups
Devising a way to measure the success of a good NPI process is a challenge. What works for one company may not work for another. Those differences also extend across different industry verticals. However, a few measures are generally applicable across the manufacturing industry.
One such metric is the percent of new products that are successfully launched or delivered on time. A second metric is the percent of products that meet all success criteria.
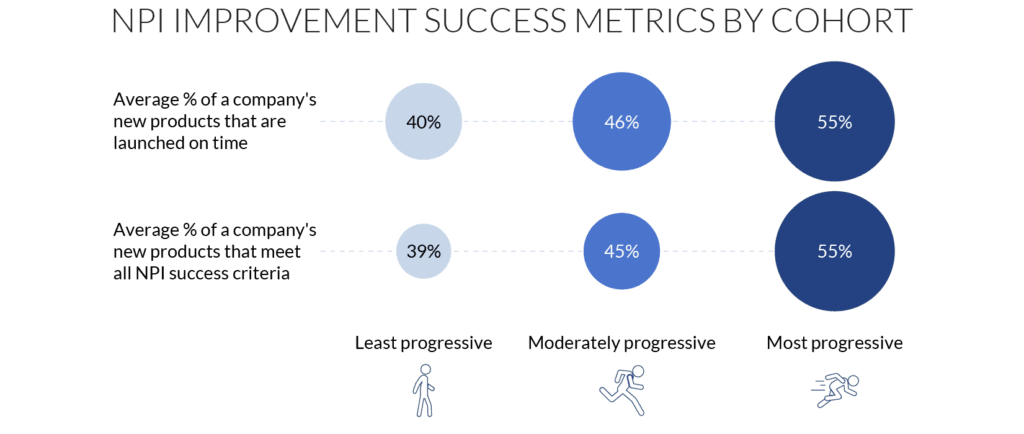
Figure 2: The most progressive launch or deliver more products on time and have more products meet all NPI success criteria.
Comparing organizations in the least progressive, moderately progressive, and most progressive groups yielded some striking results. The study revealed significant differences in these two key metrics.
To start, compared with the least progressive, the most progressive group launches or delivers 15% more of its development projects on time. Yet, the most progressive do not achieve this goal by sacrificing risk mitigation.
In fact, when the groups were compared on NPI success criteria, the most progressive respondents were found to have met those goals 16% more often than the least progressive group. And compared to the other groups, more of the most progressive respondents were able to satisfy each of these competing metrics.
Takeaways
All three respondent groups face unprecedented complexity in new products, especially when it comes to the addition of new components and electronics systems. This, in turn, complicates the NPI process. The study findings showed that the most progressive organizations have adopted strategies to help them manage this complexity in a way that offers tangible benefits.
The respondents representing the most progressive organizations reported that they launched and delivered more products on time (55%), and that more of those products met all NPI success criteria (55%). These are significantly higher rates than those of their least progressive counterparts.


